

The typical organization loses about 5 percent of its revenue to occupational fraud every year, with a median loss of roughly $145,000 per case and an average approaching $1.7 million. The uncomfortable truth for employers: most of the people committing that fraud are trusted, long-tenured employees who passed their background check, which is exactly why screening has to be paired with monitoring and controls.
- Organizations lose an estimated 5 percent of annual revenue to occupational fraud, a figure the ACFE calls conservative.
- The median fraud loss is about $145,000 per case; the average is roughly $1.7 million, with total identified losses over $3.1 billion in the study.
- The median scheme runs 12 months before detection, costing about $9,900 per month it goes unnoticed.
- Most fraudsters (about 86 to 87 percent) are first-time offenders with no prior criminal history, and most passed a pre-employment background check.
- The top behavioral red flag, in about 39 percent of cases, is living beyond their means, consistent since 2008.
- Tips catch about 43 percent of fraud, more than 3x the next method, so hotlines and monitoring matter as much as the initial screen.
What’s in This Report
1 The Cost of Occupational Fraud
The definitive source on workplace fraud is the Association of Certified Fraud Examiners (ACFE) Report to the Nations, a biennial study built on thousands of real, investigated cases across more than 130 countries. Its central estimate has held steady for years: the typical organization loses about 5 percent of its revenue to occupational fraud annually. The ACFE stresses this is a conservative figure, because many frauds go undetected and indirect costs like lost productivity and reputational harm are hard to measure.
The scale is significant. In the most recent Report to the Nations, total identified losses across the studied cases exceeded $3.1 billion, drawn from more than 1,900 cases. And the trend turned the wrong way: the median loss rose 24 percent between the 2022 and 2024 studies, ending a multi-period streak of declining losses. For a mid-market or enterprise organization, even the conservative 5 percent benchmark translates into a material, recurring hit to the bottom line.
Median Loss by Perpetrator Level (ACFE 2024)
Source: ACFE Report to the Nations
See the full cost of a bad hire
2 How Long Fraud Goes Undetected
Time is the multiplier. The ACFE data shows the median occupational fraud scheme runs about 12 months before it is caught, and every additional month it survives adds to the loss. The average loss per month a scheme goes undetected was about $9,900 in the most recent study, up from $8,300 in the prior report.
Tenure compounds the problem. Newer ACFE analysis found that fraudsters employed for more than 10 years caused a median loss of about $200,000, compared with roughly $50,000 for those employed less than a year. Longer-tenured, more trusted employees have more access and more time, and they are precisely the population a one-time pre-employment check will never re-examine. That gap between the initial screen and everything that happens afterward is where the largest losses accumulate.
Source: ACFE Press Release
Extend visibility past the hire date with continuous monitoring
3 Types of Fraud and Who Commits It
Occupational fraud splits into three categories, and they trade off frequency against severity. Asset misappropriation, stealing or misusing company resources, is by far the most common, occurring in about 89 percent of cases, but carries the lowest median loss at $120,000. Corruption, such as kickbacks and bribery, appears in nearly half of cases (48 percent). Financial statement fraud is the rarest, at roughly 5 percent of cases, but the costliest, with a median loss of $766,000.
| Fraud Category | Frequency | Median Loss |
|---|---|---|
| Asset misappropriation | 89% of cases | $120,000 |
| Corruption | 48% of cases | $200,000 |
| Financial statement fraud | ~5% of cases | $766,000 |
The perpetrator profile matters for prevention strategy. ACFE data shows there is no reliable psychological profile of a fraudster, but there are patterns: more than half of all cases came from just five departments, operations, accounting, sales, customer service, and executive or upper management. And the higher the perpetrator’s authority, the larger the loss, as the perpetrator-level chart above makes clear.
Source: ACFE Report to the Nations (full report)
Understand negligent hiring and retention liability
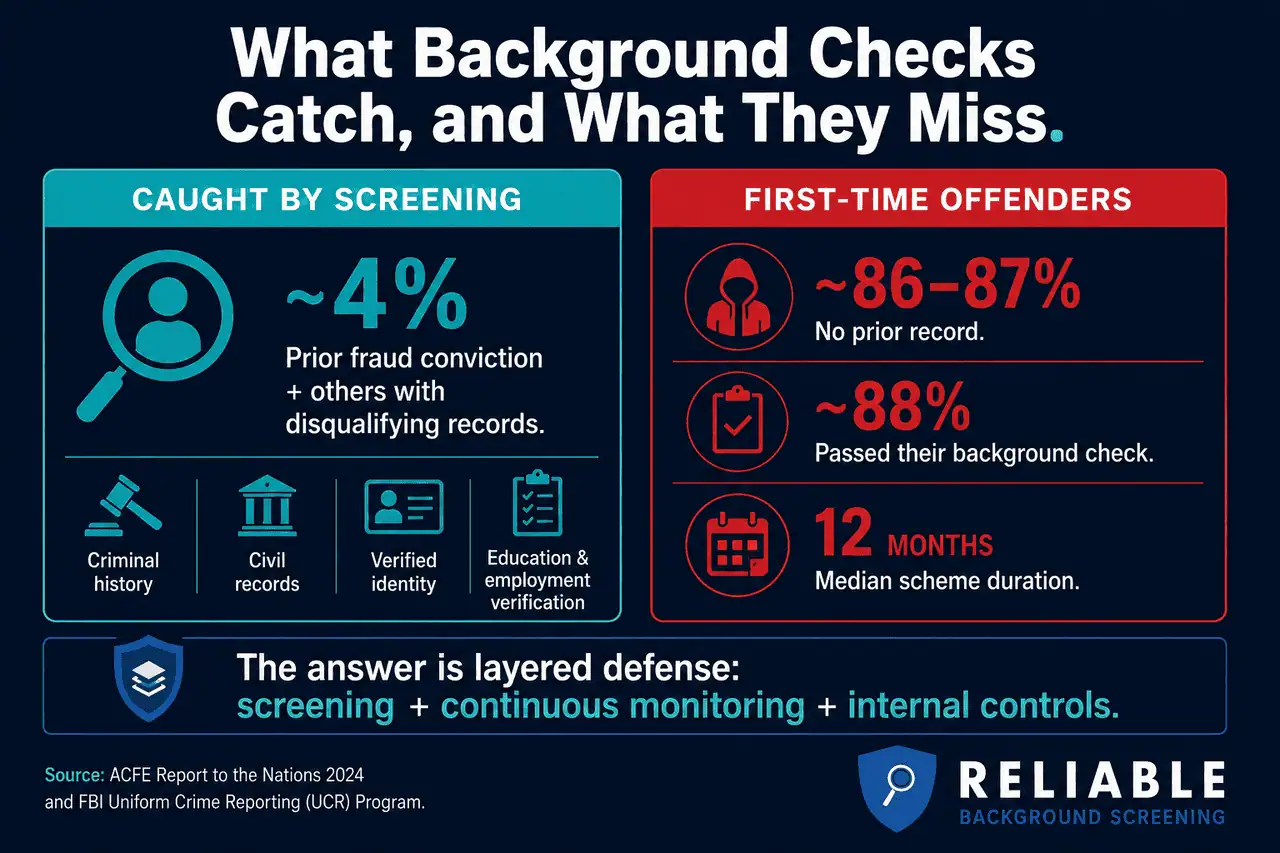
Screening catches known-risk hires; monitoring and controls catch the first-time majority (Source: ACFE).
4 What Background Checks Can and Cannot Prevent
This is the finding every employer needs to sit with honestly. ACFE data consistently shows that most occupational fraudsters, roughly 86 to 87 percent, are first-time offenders with no prior criminal or fraud history. Newer ACFE analysis reports that about 88 percent of fraudsters passed their pre-employment background checks without red flags, and roughly 12 percent showed a red flag but were hired anyway.
It would be easy, and wrong, to read this as “background checks don’t work.” The honest reading is more useful. A background check reliably identifies the smaller but serious subset of applicants who do have a relevant history, the roughly 4 percent with a prior fraud conviction and others whose record is genuinely disqualifying for a role. Catching even that share prevents real losses and is a core part of negligent-hiring defense. What screening cannot do is predict first-time fraud driven by later financial pressure and opportunity. That requires a layered approach.
Two ACFE findings, combined, define the right strategy. First, background checks screen out the roughly 4 percent of perpetrators with a prior fraud conviction plus others with disqualifying records, real, preventable loss. Second, the other majority are first-time offenders whose median scheme still runs about 12 months.
Interpretation: the pre-employment check is the necessary first layer (it removes known-risk hires and supports negligent-hiring defense), and continuous monitoring plus internal controls form the second layer (they shorten the 12-month detection window for everyone else). Neither layer replaces the other. Sources: ACFE Report to the Nations (2024 and 2026 analyses). Calculation and interpretation original to Reliable Background Screening.
Source: ASIS / ACFE 2026 Report Analysis
Why “you should have known” is the standard employers face
5 Behavioral Red Flags and Detection
If criminal history alone does not predict fraud, behavior often does. The ACFE finds that most fraudsters, around 84 percent, display at least one behavioral red flag before being caught. The single most common, seen in about 39 percent of cases and the top indicator in every study since 2008, is living beyond one’s means. Financial difficulties rank second at about 27 percent.
Detection method is the other half of the story. Tips catch about 43 percent of occupational fraud, more than three times the next most common method. Employees, vendors, and customers are the eyes that spot what a control might miss, which is why a formal reporting hotline paired with fraud-awareness training so reliably shortens detection time and reduces loss. Roughly 16 percent of fraudsters, though, display no behavioral red flag at all, another reason no single detection method is enough.
Source: ACFE Fraud Magazine
Build a comprehensive screening and monitoring policy
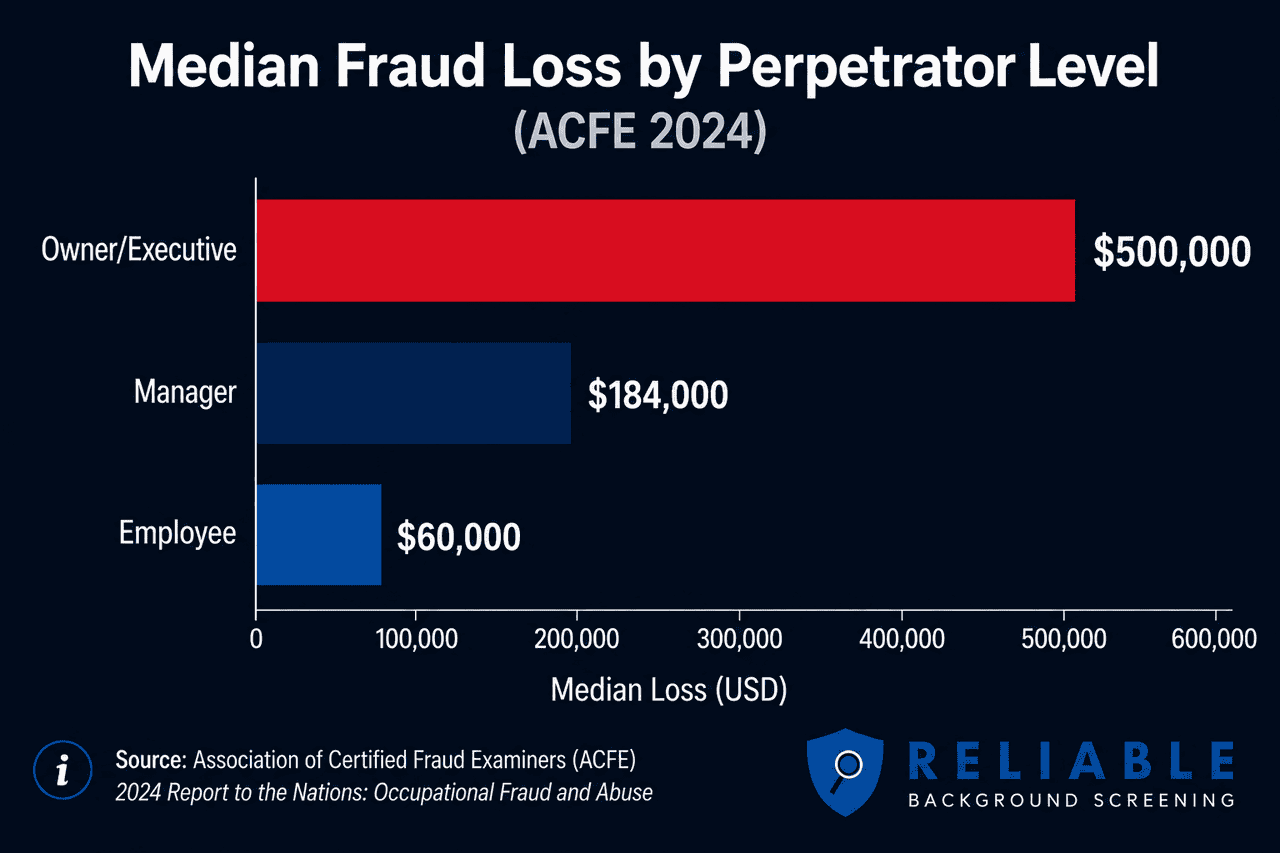
The higher the perpetrator’s authority, the larger the loss (Source: ACFE Report to the Nations 2024).
6 The Controls That Actually Reduce Loss
The prevention data is encouraging because it is actionable. The ACFE found that more than half of all fraud cases correlated with a lack of internal controls or a management override of existing controls. The corollary is that the presence of anti-fraud controls is consistently associated with lower losses and faster detection. Analyses of the data attribute reductions in fraud loss of up to roughly 50 percent to strong controls such as audits, hotlines, and monitoring.
For employers, the practical program is a stack, not a single tool: a thorough pre-employment background check to screen out known-risk hires and support negligent-hiring defense; continuous criminal monitoring to catch reportable events after the hire date; a reporting hotline to capture the tips that find 43 percent of fraud; and internal controls and audits to close the opportunity that most schemes exploit. Each layer covers a gap the others leave open.
Source: ACFE Study Analysis
Design a layered screening and monitoring program
Employee Theft and Workplace Fraud Statistics 2026: Summary Table
| Statistic | Figure | Source | Year |
|---|---|---|---|
| Revenue lost to occupational fraud | ~5% | ACFE | 2024 |
| Median loss per case | $145,000 | ACFE | 2024 |
| Average loss per case | ~$1.7 million | ACFE | 2024 |
| Total identified losses in study | $3.1 billion+ | ACFE | 2024 |
| Median loss increase, 2022 to 2024 | +24% | ACFE | 2024 |
| Median scheme duration | 12 months | ACFE | 2024 |
| Average loss per undetected month | $9,900 | ACFE | 2024 |
| Asset misappropriation frequency | 89% of cases | ACFE | 2024 |
| Corruption frequency | 48% of cases | ACFE | 2024 |
| Financial statement fraud median loss | $766,000 | ACFE | 2024 |
| Owner/executive median loss | $500,000 | ACFE | 2024 |
| First-time offenders (no prior record) | 86–87% | ACFE | 2024 |
| Fraudsters who passed background checks | ~88% | ACFE | 2026 |
| Perpetrators with prior fraud conviction | ~4% | ACFE | 2026 |
| Displayed at least one behavioral red flag | ~84% | ACFE | 2024 |
| “Living beyond means” red flag | ~39% | ACFE | 2024 |
| Fraud detected by tips | ~43% | ACFE | 2024 |
| Cases tied to weak/overridden controls | 50%+ | ACFE | 2024 |
Frequently Asked Questions
How much do businesses lose to employee theft and fraud each year?
How long does employee fraud go undetected?
Do background checks prevent employee fraud?
What is the most common warning sign of employee fraud?
How is most occupational fraud detected?
Methodology and Sources
This report compiles employee theft and workplace fraud statistics primarily from the Association of Certified Fraud Examiners (ACFE) Report to the Nations, the largest and most widely cited global study of occupational fraud, built on thousands of real investigated cases across more than 130 countries. Figures for revenue loss (~5%), median loss ($145,000), average loss (~$1.7 million), scheme duration (12 months), scheme categories, perpetrator profiles, red flags, and detection methods are drawn from the ACFE 2024 Report to the Nations and its official summaries. Figures specifically attributed to the ACFE 2026 report, including the share of fraudsters who passed pre-employment background checks (~88%) and those with a prior fraud conviction (~4%), are drawn from published analysis of that report (Security Management / ASIS); readers should consult the primary ACFE 2026 report for full context.
Where a figure is labeled “ACFE-based,” it reflects analysis or synthesis of ACFE data by third parties rather than a single headline ACFE statistic (for example, the “up to 50%” loss-reduction estimate associated with strong controls). Some percentages for behavioral red flags vary slightly across summaries (for example, 75% vs. 84% displaying at least one red flag) depending on the exact metric and edition cited; the most commonly reported figures are used and labeled by year. Statistics that could not be traced to the ACFE or another authoritative source have been excluded.