
Background screening is now nearly universal: roughly 93 to 96 percent of U.S. employers run some form of check before hiring, inside a U.S. services market worth about $3.2 billion in 2026. Yet as adoption plateaus, the risk it guards against is climbing, with candidate discrepancies, synthetic identities, and AI-assisted resume fraud all trending sharply upward.
- The U.S. background check services industry is valued at about $3.2 billion in 2026 across roughly 1,597 businesses, per IBISWorld, a mature market where scale matters less than compliance expertise and accuracy.
- Screening is nearly universal: 93 to 96 percent of U.S. employers conduct background checks, per the PBSA and HR.com annual survey, with criminal checks the most common type at roughly 93 to 94 percent.
- More than three-quarters of employers uncovered a candidate discrepancy in the past year, and nearly two in five found one in every 20 candidates screened, per HireRight’s 2025 Global Benchmark Report.
- Overall workforce drug positivity was 4.4 percent in 2024, but fentanyl positivity ran 707 percent higher in random tests than in pre-employment tests, per the 2025 Quest Diagnostics Drug Testing Index.
- Gartner projects that by 2028, one in four candidate profiles worldwide could be fraudulent, pushing employers toward identity verification and continuous monitoring.
- Market growth splits by scope: the mature U.S. services market grows about 1 percent in 2026, while background check software is forecast to grow at roughly 9 to 10 percent CAGR into the early 2030s.
What’s in This Report
1 Background Check Industry Market Size
The U.S. background check services industry generates about $3.2 billion in revenue in 2026, spread across roughly 1,597 businesses, according to IBISWorld. This is a mature, fragmented market: the average firm employs fewer than 11 people, and revenue has been essentially flat over the prior five years. That structure keeps pricing power diffuse and pushes providers to compete on service quality, compliance expertise, and technology rather than sheer scale.
Global figures vary far more, because analysts define the “market” differently. Estimates for the broader background check market range from roughly $3.4 billion (services only, per Market Research Future) to more than $9 billion (services plus platforms, per Business Research Insights), with software-focused forecasts from Grand View Research projecting the U.S. background check software segment alone growing at about 9.2 percent annually through 2033. The takeaway for buyers: growth is concentrated in technology and automation, not in the traditional services core.
Background Check Market Size Estimates by Source, 2025–2026 (USD Billions)
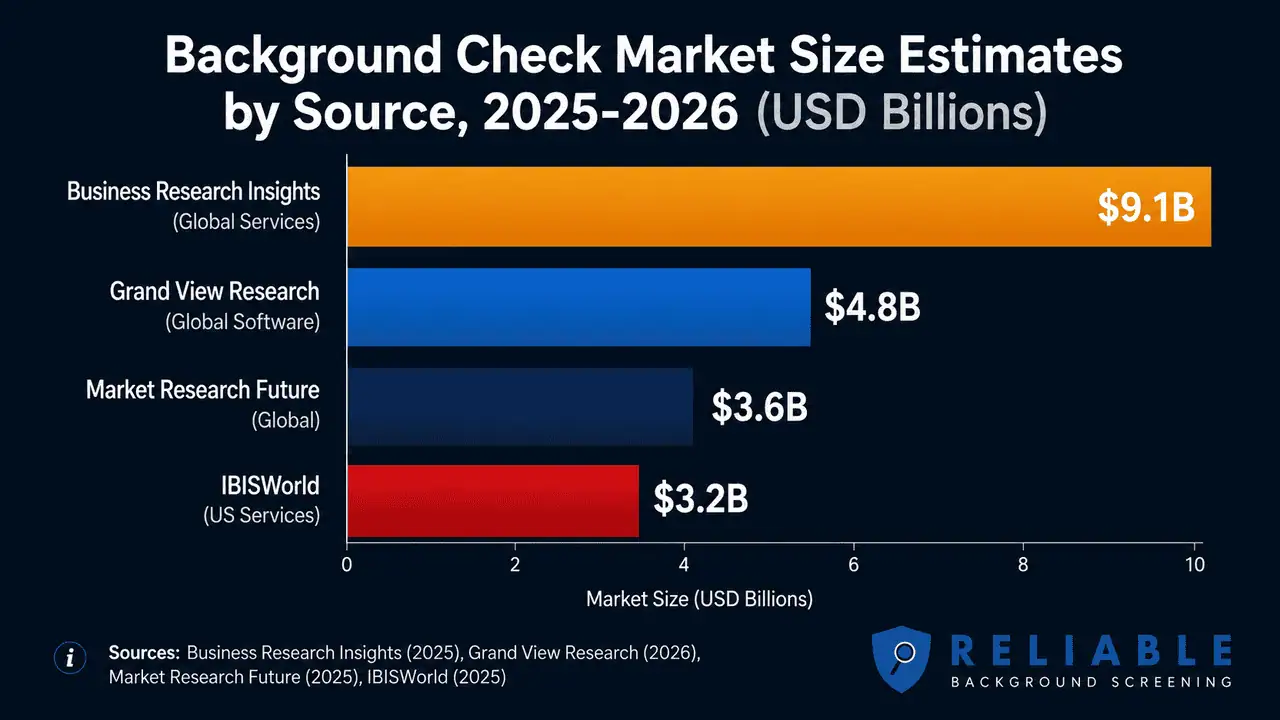
Market-size estimates vary widely by scope, from $3.2B for U.S. services to over $9B globally (Source: IBISWorld, Grand View, MRFR, Business Research Insights).
Source: IBISWorld | Grand View Research
See what separates an accurate screening partner from a database reseller
2 How Many Employers Run Background Checks
Background screening has become a standard part of hiring. The Professional Background Screening Association (PBSA), partnering with the HR Research Institute at HR.com, surveys thousands of HR professionals each year. Their research consistently finds screening is nearly universal among U.S. employers, with reported adoption in the 93 to 96 percent range across survey years. Screening is somewhat less common among organizations with no U.S. locations, at roughly 79 percent.
The motivation matters as much as the rate. For U.S. employers, the most common reason to screen is protecting employees and customers, cited by about 76 percent. Improving quality of hires is a top-three motivation for roughly half of U.S. employers. Timing has settled into a clear pattern too: most employers screen after an interview or after extending a conditional offer, rather than at the top of the funnel.
One area still maturing is continuous, post-hire monitoring. PBSA figures indicate only about 19 to 21 percent of employers currently include continuous criminal monitoring in their programs, meaning the large majority still rely on a single point-in-time check and have no routine mechanism to catch a reportable offense that occurs after the hire date.
Combining two Tier 1 data points reveals a structural blind spot. PBSA reports that roughly 93 to 96 percent of U.S. employers screen at hire, but only about 19 to 21 percent conduct continuous criminal monitoring afterward.
Formula: ~95% screen at hire − ~20% monitor continuously = a roughly 75-percentage-point gap between employers who vet once and employers who keep watching.
Interpretation: for three out of four screened employees, the employer’s risk visibility effectively ends the day the report clears. Sources: PBSA / HR.com annual survey; PBSA continuous monitoring figures. Calculation and interpretation original to Reliable Background Screening.
Source: Professional Background Screening Association | HR.com Research Institute
Close the post-hire gap with continuous criminal monitoring
3 Most Common Types of Background Checks
Not all checks are ordered equally. Across PBSA survey years, criminal history checks are consistently the most common component, reported by roughly 93 to 94 percent of employers that screen. Importantly, the research pushes back on a long-standing misconception: fingerprint-based checks are often called the “gold standard,” but PBSA notes they have significant limitations and are not recommended as a single source, because they depend on incomplete arrest databases rather than court-verified dispositions.
| Check Type | Prevalence Among Screening Employers | Source |
|---|---|---|
| Criminal history | 93–94% | PBSA / HR.com |
| Documented screening policy in place | ~77% | PBSA / HR.com |
| Identity verification (global) | ~60% | HireRight 2025 |
| Education verification (at least sometimes) | ~77% | Industry survey data |
| Continuous criminal monitoring | ~19–21% | PBSA |
Identity verification is the fastest-emerging category. HireRight’s 2025 Global Benchmark Report found only about three in five employers globally conduct identity checks as part of pre-employment screening, a notable gap given the rise in synthetic identity fraud covered in the next section.
Source: PBSA Trends Report | HireRight 2025 Global Benchmark Report
Add identity verification to your screening program
4 Resume Fraud and Candidate Discrepancy Rates
The demand case for screening rests on how often candidate claims fail verification, and the numbers are moving in the wrong direction for employers. HireRight’s 2025 Global Benchmark Report, drawn from more than 1,000 HR, risk, and talent professionals worldwide, found that more than three-quarters of respondents uncovered at least one candidate discrepancy in the prior 12 months.
The nature of the deception is also changing. Employment-verification discrepancies rose sharply in recent years, and a new category of risk has emerged: AI-assisted and synthetic-identity fraud. Gartner has projected that by 2028, as many as one in four candidate profiles worldwide could be fraudulent, with some using AI-generated audio and video to bypass screening. This shifts the challenge from catching an inflated job title to confirming the candidate is a real person at all.
Candidate Discrepancy Frequency Reported by Employers (HireRight 2025)
Enterprise organizations of 5,000 or more employees were far more likely to detect discrepancies than small and mid-sized businesses, a pattern that reflects both higher application volume and more rigorous verification. For mid-market and enterprise buyers, the implication is direct: as fraud tooling gets cheaper, multi-layer verification and identity confirmation move from optional to essential.
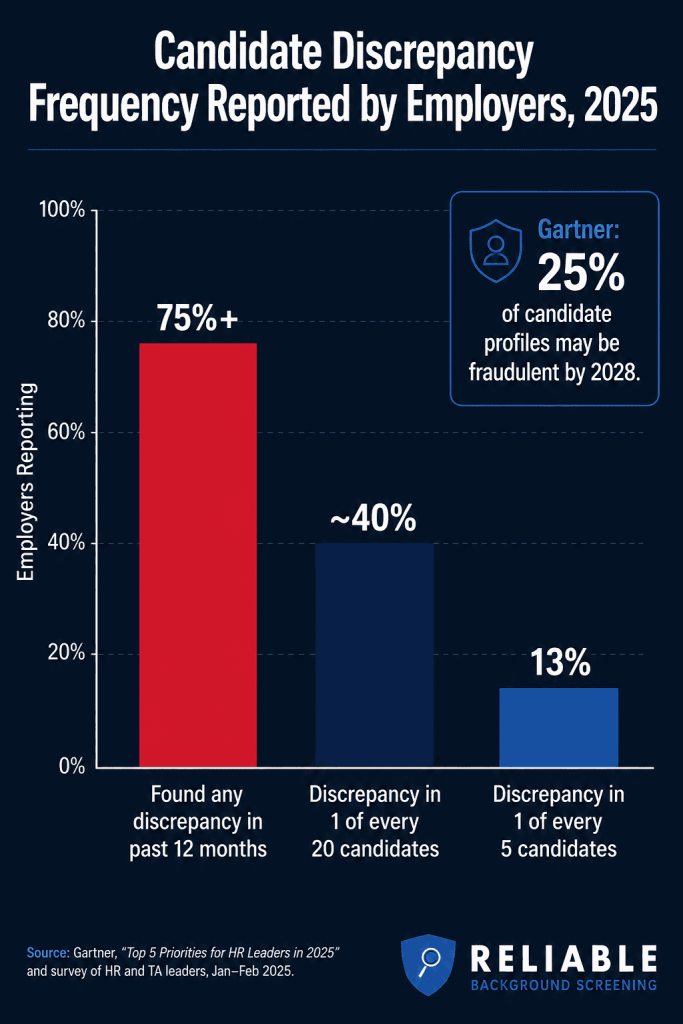
More than three-quarters of employers found a candidate discrepancy in the past year (Source: HireRight 2025 Global Benchmark Report).
Source: HireRight 2025 Global Benchmark Report
Verify employment and education with court-grade accuracy
5 Workforce Drug Testing Statistics
Drug screening remains a core component of many programs, and the 2025 Quest Diagnostics Drug Testing Index, based on analysis of more than 8 million tests, is the industry’s most-cited primary source. Overall workplace urine drug positivity edged down to 4.4 percent in 2024 from 4.6 percent the prior year. Marijuana remained the most frequently detected substance, holding steady at 4.5 percent in the general U.S. workforce.
The headline finding is about what pre-employment testing alone misses. In 2024, fentanyl positivity in the general U.S. workforce was 707 percent higher in random tests (1.13 percent) than in pre-employment tests (0.14 percent), suggesting workers who pass an initial screen may begin or resume use afterward. Post-accident marijuana positivity also stayed elevated at 7.3 percent, just below the record 7.5 percent set in 2023.
A pre-employment drug test is a snapshot. The Quest data shows that for a substance like fentanyl, that snapshot captures only a fraction of eventual workforce use, because random and for-cause testing detect far more. This is the same structural argument that applies to continuous criminal monitoring: point-in-time screening is necessary but not sufficient for ongoing safety-sensitive roles.
Source: Quest Diagnostics 2025 Drug Testing Index
Explore pre-employment and workforce drug screening options
6 The Cost of a Bad Hire and Negligent Hiring
The financial logic behind screening rests on the cost of getting a hire wrong. A widely cited benchmark holds that a bad hire costs roughly 30 percent of the employee’s first-year earnings, a figure Reliable Background Screening references in explaining why comprehensive checks pay for themselves. Beyond direct replacement costs, employers face negligent hiring and retention liability, where a single failure to conduct reasonable due diligence can produce settlements that dwarf the cost of screening an entire workforce.
These downstream costs, replacement, theft, workplace-safety incidents, and litigation exposure, are precisely what a properly scoped screening program is designed to reduce. They also explain why adoption has plateaued near universal levels while spend continues to shift toward deeper verification, identity confirmation, and ongoing monitoring rather than the cheapest possible database pull.
Source: HireRight 2025 Global Benchmark Report
Talk to an FCRA-certified screening advisor about your risk profile
Background Check Industry Statistics 2026: Summary Table
| Statistic | Figure | Source | Year |
|---|---|---|---|
| U.S. background check services market size | ~$3.2 billion | IBISWorld | 2026 |
| Businesses in U.S. services industry | ~1,597 | IBISWorld | 2026 |
| U.S. services market growth | ~1.0% | IBISWorld | 2026 |
| Global software segment CAGR | ~9.2% | Grand View Research | 2026–2033 |
| U.S. employers that screen | 93–96% | PBSA / HR.com | 2024–2025 |
| Non-U.S. organizations that screen | ~79% | PBSA / HR.com | 2024–2025 |
| Screen to protect employees/customers | 76% | PBSA / HR.com | 2024–2025 |
| Criminal history check prevalence | 93–94% | PBSA / HR.com | 2024–2025 |
| Documented screening policy | ~77% | PBSA / HR.com | 2024–2025 |
| Continuous criminal monitoring adoption | ~19–21% | PBSA | 2024–2025 |
| Identity checks conducted (global) | ~60% | HireRight | 2025 |
| Employers finding any discrepancy | 75%+ | HireRight | 2025 |
| Discrepancy in 1 of every 5 candidates | 13% | HireRight | 2025 |
| Overall workforce drug positivity | 4.4% | Quest Diagnostics | 2024 |
| Marijuana positivity (general workforce) | 4.5% | Quest Diagnostics | 2024 |
| Fentanyl random vs. pre-employment gap | 707% higher | Quest Diagnostics | 2024 |
| Projected fraudulent candidate profiles | 25% | Gartner | by 2028 |
Frequently Asked Questions
How big is the background check industry in 2026?
What percentage of employers conduct background checks?
How common is resume fraud and candidate discrepancy?
What is the current workforce drug positivity rate?
How fast is the background check market growing?
Methodology and Sources
This report compiles background check industry statistics from Tier 1 primary sources published in 2024 through 2026. Market sizing is drawn from IBISWorld (U.S. Background Check Services, NAICS OD6058, July 2026), Grand View Research, Market Research Future, and Business Research Insights; because these firms scope the market differently (services only vs. services plus software and platforms), figures are presented as a range rather than a single number. Employer behavior statistics are from the Professional Background Screening Association (PBSA) and the HR Research Institute at HR.com annual industry survey. Candidate discrepancy and identity-fraud figures are from HireRight’s 2025 Global Benchmark Report (1,000+ HR, risk, and talent professionals). Workforce drug positivity figures are from the 2025 Quest Diagnostics Drug Testing Index (8M+ tests). The projection that 25% of candidate profiles may be fraudulent by 2028 is attributed to Gartner.
Where prevalence figures vary across survey years (for example, employer screening rates reported between 93% and 96%), the range is shown rather than a single point estimate. The “$50 billion employee theft” and “~30% of salary bad-hire cost” figures are widely cited industry estimates rather than a single audited primary source and should be treated as directional benchmarks. Statistics that could not be traced to a primary source have been excluded.